Salon reports and KPIs: a practical owner's dashboard
Short answer: A salon dashboard should answer four questions: how much bookable capacity was sold, how reliably clients attended, what each completed visit earned, and whether clients returned. Define every formula before comparing periods. Use operational reports to run the salon, while leaving bookkeeping, tax returns and industry benchmarks to the systems and professionals responsible for them.
More charts do not create more control. A useful report leads to a decision: open another shift, change a reminder, review a service duration, coach a specialist or investigate a payment mismatch. Start with six stable measures and one weekly review rather than twenty numbers that nobody can explain.
Which salon KPIs are worth tracking?
Use a small scorecard with an explicit numerator, denominator and time window.
| KPI | Working formula | What it helps decide |
|---|---|---|
| Capacity utilisation | booked service minutes ÷ bookable working minutes × 100 | whether supply matches demand |
| Completion rate | completed visits ÷ visits expected in the period × 100 | whether booked work becomes delivered work |
| No-show rate | no-shows ÷ visits expected in the period × 100 | whether reminders or booking rules need attention |
| Average ticket | recognised service and retail revenue ÷ paid completed visits | pricing and service-mix review |
| Rebooking rate | eligible clients who book a next visit within the chosen window ÷ eligible clients | retention workflow quality |
| Revenue per bookable hour | recognised revenue ÷ bookable staff hours | how effectively paid capacity is used |
Write the definition beside the number. For example, decide whether “expected visits” excludes client cancellations, salon cancellations and free consultations. Decide whether average ticket includes gift-card sales or only redemption. Once selected, do not change the rule halfway through a comparison.
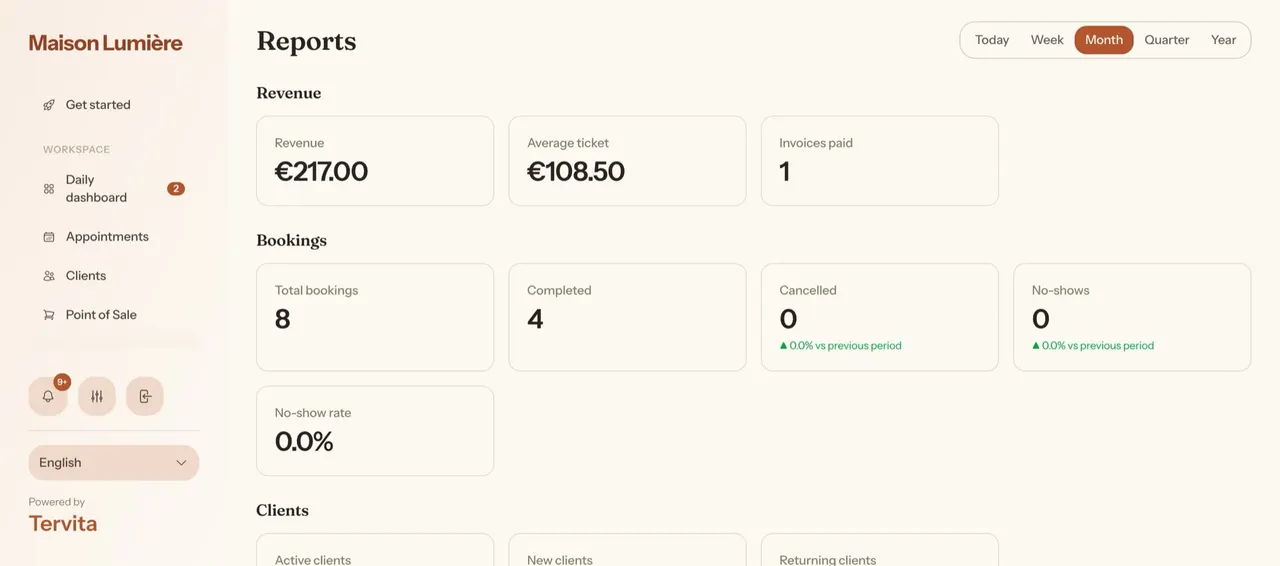
Tervita's reports guide describes the product's actual views: summary figures, revenue trend, payment mix, staff performance, client trends, busiest times, services and branches. Those are operational views. They do not replace the sales ledger, bank reconciliation, VAT return or annual accounts. The Estonian Tax and Customs Board remains the primary source for tax obligations.
Model one operating week
Change the inputs to see how denominator choices affect four common salon indicators. Nothing is saved.
- Capacity utilisation
- 65%
- No-show rate
- 6,3%
- Average ticket
- €76.19
- Revenue per bookable hour
- €53.33
This is a management model, not accounting or a benchmark. Keep the same definitions when comparing periods.
How do you calculate capacity without fooling yourself?
The denominator matters more than the chart. Bookable time is not every hour between opening and closing. Remove holidays, approved leave, training, non-bookable admin blocks and resources that make the service impossible. If a treatment needs both a specialist and one device, available capacity is constrained by the scarcer resource.
Suppose two specialists each offer 30 bookable hours in a week. Together they have 60 hours. If completed and still-upcoming appointments occupy 39 hours, utilisation is 65%. If you divide by a nominal 80-hour opening week instead, the number becomes 49% and suggests a problem that may not exist.
Read utilisation with lead time. An empty slot tomorrow is different from an empty slot six weeks away. Compare the same booking horizon: for example, how full next week looked every Monday morning. The booking analytics guide explains how booking events and conversion views complement the final appointment report.
What should a weekly report review look like?
Choose one fixed 30-minute appointment. Compare the last complete week with the previous complete week and, when seasonality matters, the comparable period last year. Keep the agenda concrete:
- Confirm that cash, card, bank transfer, gift card and other payment totals have been reconciled.
- Look for data-quality problems: unfinished appointments, wrong statuses, missing staff or services.
- Review utilisation, completion and no-show rates together.
- Examine the largest changes by service, specialist, weekday and location.
- Assign at most three actions, each with an owner and review date.
A fall in revenue is a prompt to investigate, not a diagnosis. It may come from fewer bookable hours, a holiday, a lower-priced service mix, delayed payment entry or genuinely weaker demand. Likewise, high utilisation can hide an unhealthy schedule with no recovery time or room for urgent clients.
How should staff performance be compared fairly?
Do not publish a league table based on raw revenue. A new employee, a part-time specialist and a senior practitioner with longer premium services operate under different constraints. Compare a person primarily with their own previous periods, then add context: bookable hours, service mix, new-client share, cancellations and reviews.
Separate pay calculations from coaching metrics. Tervita's staff pay and commission guide explains how configured salary and commission rules produce a payroll figure. That figure is not the same as productivity, profitability or quality. A commission ledger tells you what is owed under a rule; it does not prove that the rule is commercially optimal.
Reviews also need a minimum sample. An average based on two reviews should not outweigh an average based on fifty. Read the comments, verify whether the feedback concerns the specialist or the booking process, and never use health notes as a performance label.
How do revenue and cash differ?
Bookings, sales, invoices, payments and bank deposits are different events. A package may be paid today and redeemed over several visits. A gift card may be sold by one employee and used with another. An invoice can be issued before or after payment. Refunds and tips require their own treatment. Therefore “revenue” must be tied to the report's stated recognition rule.
For management, choose a consistent operational view and reconcile it to the accounting records. For statutory reporting, follow your accountant's treatment and current Estonian rules. Do not copy a dashboard total into a VAT return without checking what it includes.
What are common KPI mistakes?
- Comparing partial today with a complete yesterday.
- Changing status definitions between locations.
- Treating a marketplace commission, payment fee and subscription as the same cost.
- Counting cancelled time as available in one month but not another.
- Optimising average ticket by pushing unsuitable add-ons.
- Presenting a small sample as an industry benchmark.
- Tracking a number without recording the action it should trigger.
Good reporting starts with clean daily operations. Standardise appointment statuses, payment methods, service names and staff ownership. The client-management workflow helps keep records useful without turning notes into an uncontrolled archive.
A simple dashboard to start this week
Create one table with the six KPIs above, the current value, previous value, definition and action threshold. Add a short note explaining the biggest movement. After four weeks, remove any metric that did not change a decision and add a breakdown only when it answers a recurring question.
Tervita can consolidate operational booking, revenue, staff, client and location views. The owner still defines the business question, verifies the input and decides what to do. That division is healthy: software should make evidence visible, not pretend to be your accountant or management consultant. Start a 14-day Tervita trial and build the first weekly review from your own workflow.